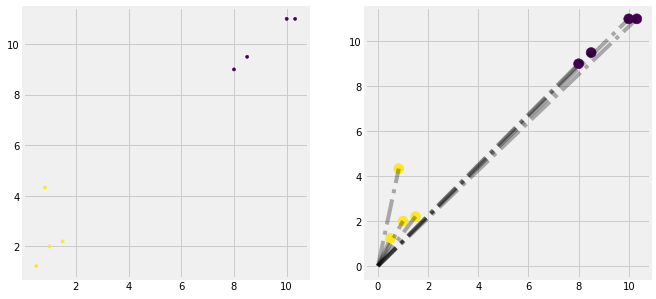
Vectors#
[1]:
import numpy as np
import pandas as pd
import matplotlib.pyplot as plt
import seaborn as sns
from matplotlib import style

plt.style.use("fivethirtyeight")

%matplotlib inline
[2]:
dataset = np.array([
    [1,2,1],
    [8,9,-1],
    [1.5,2.2,1],
    [10,11,-1],
    [0.5,1.23,1],
    [8.5,9.5,-1],
    [0.83,4.33,1],
    [10.32,11,-1]
])
columns = ['f1', 'f2', 'target']
X = dataset[:,[0,1]]
y = dataset[:,[-1]]
[3]:
fig = plt.figure(figsize=(10, 5))
ax = fig.add_subplot(1,2,1)
ax.scatter(X[:,0], X[:,1], c=y, s=10)

ax = fig.add_subplot(1,2,2)
ax.scatter(X[:, 0], X[:, 1], c=y, s=100)

for i in dataset[:,[0,1]]:
    ax.plot([0,i[0]],[0,i[1]] ,'k-.', alpha=0.3)

plt.show()
dot product#
[4]:
x = np.array([[1],[2]])
y = np.array([[2],[3]])

(
    x.shape ,
    y.shape
)
[4]:
((2, 1), (2, 1))
[5]:
x * y
[5]:
array([[2],
       [6]])
cross product#
[6]:
(
    x ,
    y.T ,
    x @ y.T
)
[6]:
(array([[1],
        [2]]),
 array([[2, 3]]),
 array([[2, 3],
        [4, 6]]))
magnitude \(||\vec{A}||\)#
[7]:
(
    x,
    np.sqrt(np.sum(x**2)),
    np.linalg.norm(x)
)
[7]:
(array([[1],
        [2]]),
 2.23606797749979,
 2.23606797749979)
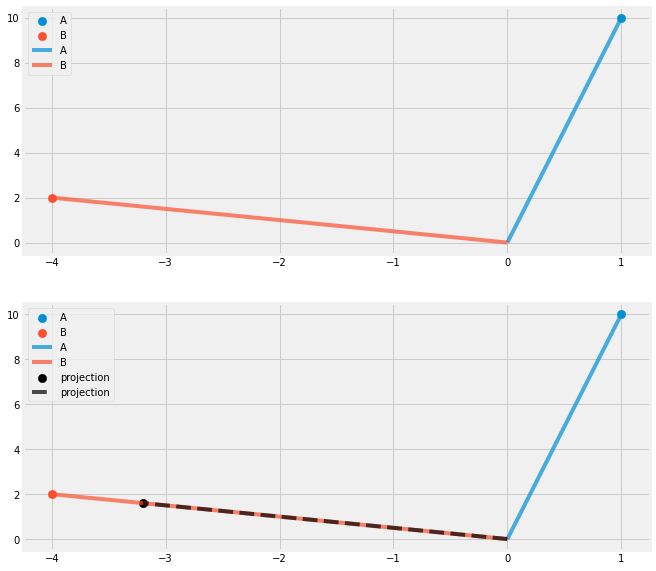
project \(\vec{A}\) to \(\vec{B}\)#
\[proj_\vec{A}(\vec{B}) = (\vec{A}.\vec{B}).\frac{\vec{B}}{||\vec{B}||^2}\]
dot product#
\(\vec{A}.\vec{B} \sim A^T.B \sim B @ A.T\)
B @ $A.T \sim `A @ :math:`B.T (only difference in shape)
[8]:
W = np.array([[1,3]])
X = np.array([[4,5],[6,7],[1,8]])

W.shape, X.shape
[8]:
((1, 2), (3, 2))
[9]:
W @ X.T
[9]:
array([[19, 27, 25]])
[10]:
X @ W.T
[10]:
array([[19],
       [27],
       [25]])
Projection#
[11]:
def projection(A, B):
    return (B @ A.T) * (B / np.linalg.norm(B)**2)
[12]:
A = np.array([[1,10]])
B = np.array([[-4,2]])

fig = plt.figure(figsize=(10,10))
ax = fig.add_subplot(2,2,(1,2))

ax.scatter(A[:,[0]],A[:,[1]],s=70,label="A")
ax.scatter(B[:,[0]],B[:,[1]],s=70,label="B")


for i in A:
    ax.plot([0,i[0]],[0,i[1]],alpha=0.7,label='A')
for i in B:
    ax.plot([0,i[0]],[0,i[1]],alpha=0.7,label='B')

ax.legend(loc='best')


ax = fig.add_subplot(2,2,(3,4))

ax.scatter(A[:,[0]],A[:,[1]],s=70,label='A')
ax.scatter(B[:,[0]],B[:,[1]],s=70,label='B')

for i in A:
    ax.plot([0,i[0]],[0,i[1]],alpha=0.7,label='A')
for i in B:
    ax.plot([0,i[0]],[0,i[1]],alpha=0.7,label='B')

proj = projection(A,B)

ax.scatter(proj[:,[0]],proj[:,[1]],s=70,label="projection",c='black')
for i in proj:
    ax.plot([0,i[0]],[0,i[1]],c='black',alpha=0.7,label="projection",ls='--')

ax.legend(loc='best')
plt.show()