Anomaly Detection using Scikit-Learn#
[26]:
import matplotlib.pyplot as plt
import seaborn as sns
import numpy as np
Isolation Forest#
[32]:
from sklearn.ensemble import IsolationForest
true_cov = np.array([[.8, .3],
                     [.3, .4]])
X = np.random.RandomState(0).multivariate_normal(mean=[0, 0],
                                                 cov=true_cov,
                                                 size=500)
X_test = np.array([[0, 0],[3, 3]])
[34]:
clf = IsolationForest(random_state=0).fit(X)
clf.predict(X_test)
[34]:
array([ 1, -1])
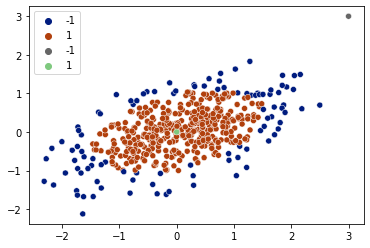
[35]:
detections = clf.predict(X)
sns.scatterplot(x=X[:,0], y=X[:,1], hue=detections, palette='dark')

detections = clf.predict(X_test)
sns.scatterplot(x=X_test[:,0], y=X_test[:,1], hue=detections, palette='Accent_r')

plt.legend()
[35]:
<matplotlib.legend.Legend at 0x7f1f3c3ec070>
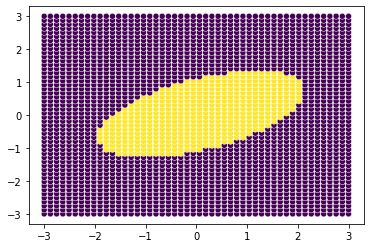
boundary#
[46]:
size=3
loc_points = np.linspace(-size,size)
all_points = np.array(np.meshgrid(loc_points, loc_points)).T.reshape(-1, 2)
points = clf.predict(all_points)

sns.scatterplot(x=all_points[...,0], y=all_points[...,1], hue=points,\
                palette='viridis',legend=False)
plt.show()
Elliptic Envelope#
[28]:
from sklearn.covariance import EllipticEnvelope
true_cov = np.array([[.8, .3],
                     [.3, .4]])
X = np.random.RandomState(0).multivariate_normal(mean=[0, 0],
                                                 cov=true_cov,
                                                 size=500)
cov = EllipticEnvelope(random_state=0).fit(X)
# predict returns 1 for an inlier and -1 for an outlier

X_test = np.array([[0, 0],[3, 3]])
[29]:
cov.covariance_
[29]:
array([[0.74118335, 0.25357049],
       [0.25357049, 0.30531502]])
[30]:
cov.location_
[30]:
array([0.0813539 , 0.04279722])
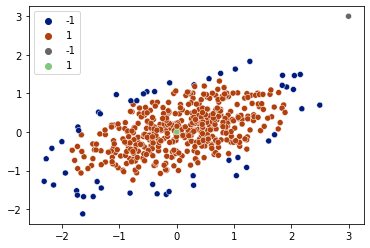
[31]:
detections = cov.predict(X)
sns.scatterplot(x=X[:,0], y=X[:,1], hue=detections, palette='dark')

detections = cov.predict(X_test)
sns.scatterplot(x=X_test[:,0], y=X_test[:,1], hue=detections, palette='Accent_r')

plt.legend()
[31]:
<matplotlib.legend.Legend at 0x7f1f3e2f3f70>
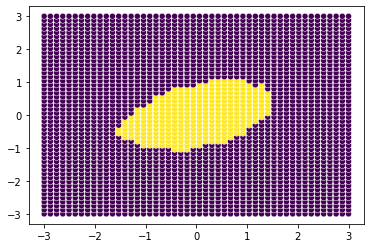
boundary#
[47]:
size=3
loc_points = np.linspace(-size,size)
all_points = np.array(np.meshgrid(loc_points, loc_points)).T.reshape(-1, 2)
points = cov.predict(all_points)

sns.scatterplot(x=all_points[...,0], y=all_points[...,1], hue=points,\
                palette='viridis',legend=False)
plt.show()