Plot 3D#
[1]:
from mpl_toolkits import mplot3d
import matplotlib.pyplot as plt
from matplotlib import style
import numpy as np


%matplotlib inline
# %matplotlib tk
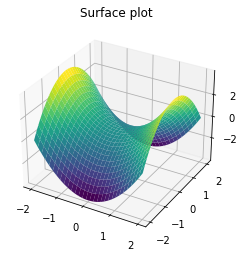
Surface#
[2]:
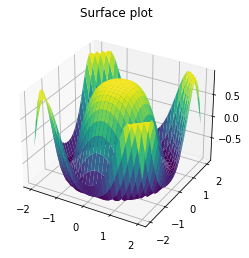
x = np.outer(np.linspace(-2, 2, 30), np.ones(30))
y = x.copy().T # transpose
z = np.cos(x ** 2 + y ** 2)

print(f"""
{x.shape = }
{y.shape = }
{z.shape = }
""")

fig = plt.figure()
ax = plt.axes(projection='3d')

ax.plot_surface(x, y, z,cmap='viridis', edgecolor='none')
ax.set_title('Surface plot')

plt.show()
x.shape = (30, 30)
y.shape = (30, 30)
z.shape = (30, 30)
wireframe#
[3]:
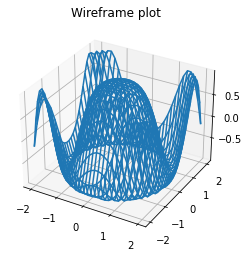
x = np.outer(np.linspace(-2, 2, 30), np.ones(30))
y = x.copy().T # transpose
z = np.cos(x ** 2 + y ** 2)

print(f"""
{x.shape = }
{y.shape = }
{z.shape = }
""")


fig = plt.figure()
ax = plt.axes(projection='3d')

ax.plot_wireframe(x, y, z,cmap='viridis')
ax.set_title('Wireframe plot')

plt.show()
x.shape = (30, 30)
y.shape = (30, 30)
z.shape = (30, 30)
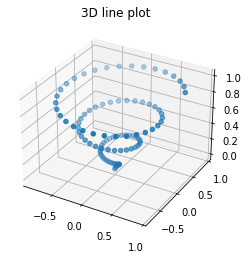
Line in 3D plane#
[4]:
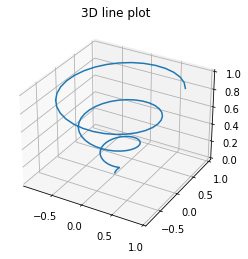
z = np.linspace(0, 1, 100)
x = z * np.sin(20 * z)
y = z * np.cos(20 * z)

print(f"""
{x.shape = }
{y.shape = }
{z.shape = }
""")


fig = plt.figure()
ax = plt.axes(projection='3d')

ax.plot3D(x, y, z)
ax.set_title('3D line plot')
plt.show()
x.shape = (100,)
y.shape = (100,)
z.shape = (100,)
Scatter in 3D plane#
[5]:
z = np.linspace(0, 1, 100)
x = z * np.sin(20 * z)
y = z * np.cos(20 * z)

print(f"""
{x.shape = }
{y.shape = }
{z.shape = }
""")


fig = plt.figure()
ax = plt.axes(projection='3d')

ax.scatter(x, y, z)
ax.set_title('3D line plot')
plt.show()
x.shape = (100,)
y.shape = (100,)
z.shape = (100,)
[6]:
x = np.outer(np.linspace(-2, 2, 30), np.ones(30))
y = x.copy().T # transpose
z = x ** 2 - y ** 2

print(f"""
{x.shape = }
{y.shape = }
{z.shape = }
""")

fig = plt.figure()
ax = plt.axes(projection='3d')

ax.plot_surface(x, y, z,cmap='viridis', edgecolor='none')
ax.set_title('Surface plot')

plt.show()
x.shape = (30, 30)
y.shape = (30, 30)
z.shape = (30, 30)
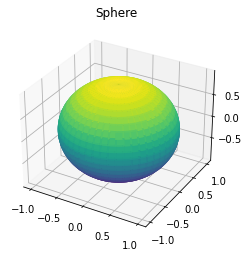
Sphere#
A surface may also be defined as the image, in some space of dimension at least 3, of a continuous function of two variables (some further conditions are required to insure that the image is not a curve). In this case, one says that one has a parametric surface, which is parametrized by these two variables, called parameters. For example, the unit sphere may be parametrized by the Euler angles, also called longitude u and latitude v by
x = cos(u).cos(v)
y = sin(u).cos(v)
z = sin(v)
Reference - https://en.wikipedia.org/wiki/Surface_(mathematics)
[12]:
u = np.linspace(-np.pi,np.pi, 100)
v = np.linspace(-np.pi,np.pi, 100)

x = np.outer(np.cos(u),np.cos(v))
y = np.outer(np.sin(u),np.cos(v))
z = np.outer(np.ones_like(u),np.sin(v))

print(f"""
{x.shape = }
{y.shape = }
{z.shape = }
""")

fig = plt.figure()
ax = plt.axes(projection='3d')

ax.plot_surface(x, y, z,cmap='viridis')
ax.set_title('Sphere')

plt.show()
x.shape = (100, 100)
y.shape = (100, 100)
z.shape = (100, 100)
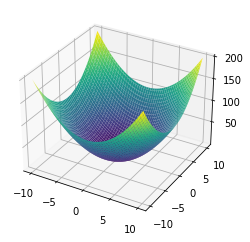
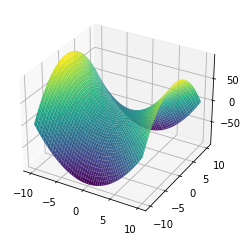
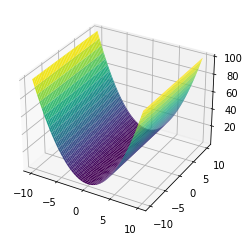
Paraboloid#
https://en.wikipedia.org/wiki/Paraboloid#Hyperbolic_paraboloid
[8]:
x,y = np.meshgrid(np.linspace(-10,10,100),np.linspace(-10,10,100))
z = np.square(x) + np.square(y)

print(f"""
{x.shape = }
{y.shape = }
{z.shape = }
""")

fig = plt.figure()
ax = plt.axes(projection='3d')

ax.plot_surface(x,y,z, cmap='viridis')

plt.show()
x.shape = (100, 100)
y.shape = (100, 100)
z.shape = (100, 100)
[9]:
x,y = np.meshgrid(np.linspace(-10,10,100),np.linspace(-10,10,100))
z = np.square(x) - np.square(y)

print(f"""
{x.shape = }
{y.shape = }
{z.shape = }
""")

fig = plt.figure()
ax = plt.axes(projection='3d')

ax.plot_surface(x,y,z, cmap='jet')

plt.show()
x.shape = (100, 100)
y.shape = (100, 100)
z.shape = (100, 100)
[10]:
x,y = np.meshgrid(np.linspace(-10,10,100),np.linspace(-10,10,100))
z = np.square(x)

print(f"""
{x.shape = }
{y.shape = }
{z.shape = }
""")

fig = plt.figure()
ax = plt.axes(projection='3d')

ax.plot_surface(x,y,z, cmap='viridis')

plt.show()
x.shape = (100, 100)
y.shape = (100, 100)
z.shape = (100, 100)
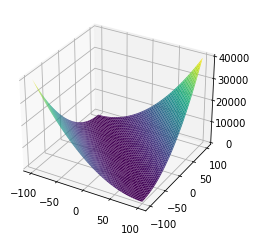
[11]:
x,y = np.meshgrid(np.linspace(-100,100,100),np.linspace(-100,100,100))
z = np.square(x+y)

print(f"""
{x.shape = }
{y.shape = }
{z.shape = }
""")

fig = plt.figure()
ax = plt.axes(projection='3d')

ax.plot_surface(x,y,z, cmap='viridis')

plt.show()
x.shape = (100, 100)
y.shape = (100, 100)
z.shape = (100, 100)