
Convolution (Signal & Image)#
References#
Basics#
In mathematics (in particular, functional analysis), convolution is a mathematical operation on two functions (f and g) that produces a third function \({\displaystyle f*g}\) that expresses how the shape of one is modified by the other.
The term convolution refers to both the result function and the process of computing it. It is defined as the integral of the product of the two functions after one is reversed and shifted. The integral is evaluated for all values of shift, producing the convolution function.
The convolution of f and g is written f*g, defined as integral of product of the two functions after one is reflected about he y-axis and shifted \begin{align} (f * g)(t) &:= \int_{-\infty}^\infty f(\tau) g(t - x) \, dx \\ & \text{ Or }\\ (f * g)(t) &:= \int_{-\infty}^\infty f(t-x) g(x)\, dx \end{align}
Looking at it differently as \begin{align} (a * b)_n = \sum_{i,j \ \forall i+j = n} a_i . b_j \\ \text{or} \\ (a * b)_n = \sum_{i = 1}^{N} a_i . b_{N - i} \end{align}
[1]:
import numpy as np
import pandas as pd
import matplotlib.pyplot as plt
import matplotlib.image as mpimg
import seaborn as sns
[2]:
x = np.array([1, 2, 3])
kernel = np.array([4, 5, 6])
numpy convolve#
[3]:
np.convolve(x, kernel)
[3]:
array([ 4, 13, 28, 27, 18])
sliding window#
|_6_|_5_|_4_|
        | 1 | 2 | 3 |           = 4 * 1 = 4

    |_6_|_5_|_4_|
        | 1 | 2 | 3 |           = 5 * 1 + 4 * 2 = 13

        |_6_|_5_|_4_|
        | 1 | 2 | 3 |           = 6 * 1 + 5 * 2 + 4 * 3 = 28

            |_6_|_5_|_4_|
        | 1 | 2 | 3 |           = 6 * 2 + 5 * 3 = 27

                |_6_|_5_|_4_|
        | 1 | 2 | 3 |           = 6 * 3 = 18
[4]:
def convolve(signal, kernel):
    total_len = len(signal) + len(kernel) - 1
    padded_signal = np.pad(signal, total_len - len(signal), mode='constant')
    rev_kernel = kernel[::-1]
    conv_res = []
    for i in range(total_len):
        seg = padded_signal[i : i+len(kernel)]
        conv_res.append((seg * rev_kernel).sum())
    return np.array(conv_res), padded_signal

result, _ = convolve(x, kernel)

result
[4]:
array([ 4, 13, 28, 27, 18])
matrix multiplication#
[5]:
mat_mul = kernel.reshape(1, -1).T @ x.reshape(1, -1)
mat_mul
[5]:
array([[ 4,  8, 12],
       [ 5, 10, 15],
       [ 6, 12, 18]])
[6]:
for i in range(-2, 3, 1):
    print(np.diagonal(mat_mul[...,::-1], offset=i, axis1=1, axis2=0).sum())
4
13
28
27
18
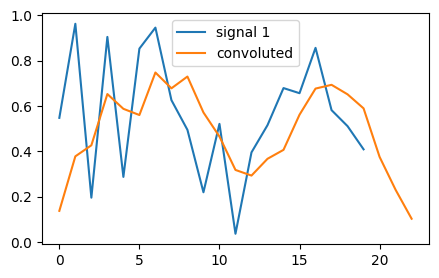
Signal Convolution#
valid: no padding. result shape will be less than input shape. \(n \times n * f \times f = n-f+1 \times n-f+1\)same: with padding p (number of layers of padding). result shape is same to input shape. \(n+p \times n+p * f \times f = n+2p-f+1 \times n+2p-f+1\)
[7]:
sine_signal1 = np.random.rand(20)
sine_signal2 = np.array([0.25, 0.25, 0.25, 0.25])
new_sine_signal = np.convolve(sine_signal1, sine_signal2)

fig = plt.figure(figsize=(5, 3))

ax = fig.add_subplot(1, 1, 1)
ax.plot(sine_signal1, label = "signal 1")
# ax.plot(sine_signal2, label = "signal 2")
ax.plot(new_sine_signal, label='convoluted')

plt.legend()
plt.show()
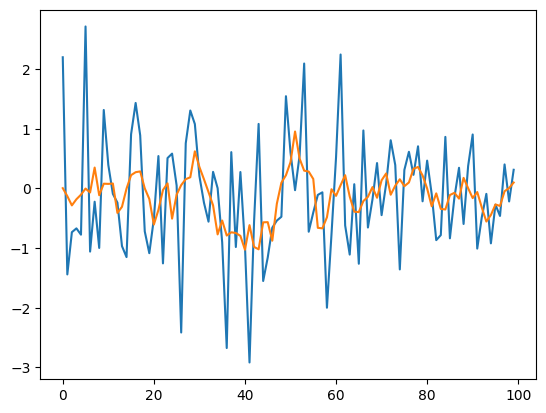
Moving Average Smoothing#
[8]:
signal_line = np.random.randn(100)
[9]:
window = 5
smoothing_signal = np.ones(window) / float(window)
[10]:
new_signal_line = np.convolve(signal_line,smoothing_signal,mode='same')
[11]:
plt.plot(signal_line)
plt.plot(new_signal_line)
[11]:
[<matplotlib.lines.Line2D at 0x22094f3e6a0>]
Matrix Convolution#
| 255 255 255 |    |  1  -1   1 |   | (255 x 1)+(255 x -1)+(255 x 1) +  |
| 255 100 255 |  x | -1   0  -1 | = | (255 x -1)+(100 x 0)+(255 x -1) + |  = -155
| 100 100 100 |    |  1  -1   1 |   | (100 x1 )+(100 x -1)+(100 x 1)    |
Elementwise product and sum
[12]:
a =np.array([
    [255, 255, 255],
    [255, 100, 255],
    [100, 100, 100]
])
b = np.array([
    [1, -1, 1],
    [-1, 0, -1],
    [1, -1, 1]
])

(a * b).sum()
[12]:
-155
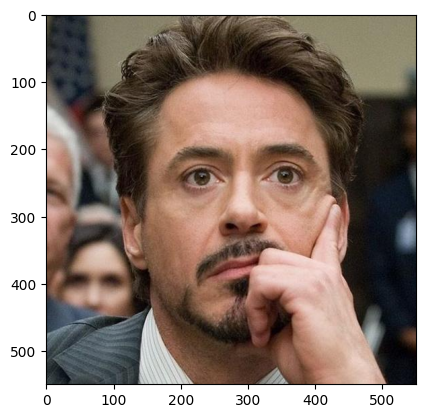
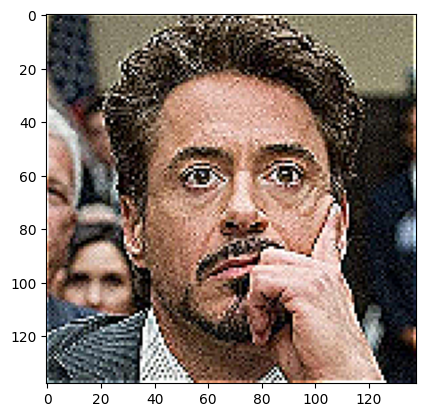
Image Convolution#
[13]:
img = mpimg.imread("./images/rdj.jpg")
img.shape
[13]:
(550, 550, 3)
[14]:
plt.imshow(img)
[14]:
<matplotlib.image.AxesImage at 0x220950d3160>
Compress image#
array[::a,::a] –> every a index from rows and columns
[15]:
x = np.array([
    [1,2,3,4],
    [2,3,4,5],
    [5,67,7,7]
])
x[::3,::3]
[15]:
array([[1, 4]])
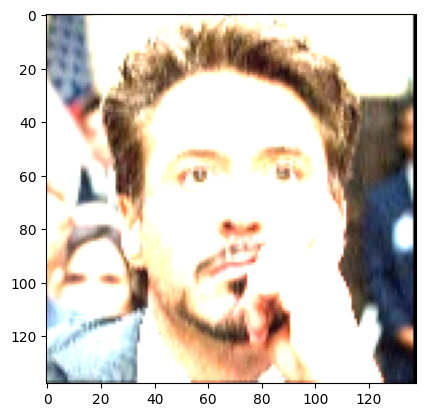
converting to float#
[16]:
a = img[::4,::4] / 255
[17]:
a.shape
[17]:
(138, 138, 3)
[18]:
plt.imshow(a)
[18]:
<matplotlib.image.AxesImage at 0x22094fd3d00>

[19]:
from scipy import signal

def apply_filter(mat, conv_filter):
    mapped_1 = signal.convolve2d(mat[:,:,0],conv_filter,mode='same')
    mapped_2 = signal.convolve2d(mat[:,:,1],conv_filter,mode='same')
    mapped_3 = signal.convolve2d(mat[:,:,2],conv_filter,mode='same')
    new_mat = np.dstack((mapped_1,mapped_2,mapped_3))

    return new_mat
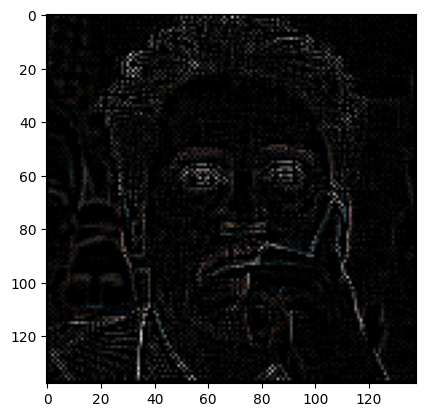
Edge Detection#
[20]:
edge_filter_mat_1 = np.array([
    [1, -1, 1],
    [-1, 0, -1],
    [1, -1, 1]
])

plt.imshow(apply_filter(a, edge_filter_mat_1))
Clipping input data to the valid range for imshow with RGB data ([0..1] for floats or [0..255] for integers).
[20]:
<matplotlib.image.AxesImage at 0x22095115e20>
[21]:
edge_filter_mat_2 = np.array([
    [1, 0, -1],
    [0, 0, 0],
    [-1, 0, 1]
])
plt.imshow(apply_filter(a,edge_filter_mat_2))
Clipping input data to the valid range for imshow with RGB data ([0..1] for floats or [0..255] for integers).
[21]:
<matplotlib.image.AxesImage at 0x2209519f970>
[22]:
edge_filter_mat_3 = np.array([
    [-1, -1, -1],
    [-1, 8, -1],
    [-1, -1, -1]
])
plt.imshow(apply_filter(a,edge_filter_mat_3))
Clipping input data to the valid range for imshow with RGB data ([0..1] for floats or [0..255] for integers).
[22]:
<matplotlib.image.AxesImage at 0x22095219e80>
Sharpen#
[23]:
sharpen_filter_mat = np.array([
    [0, -1, 0],
    [-1, 5, -1],
    [0, -1, 0]
])
plt.imshow(apply_filter(a,sharpen_filter_mat))
Clipping input data to the valid range for imshow with RGB data ([0..1] for floats or [0..255] for integers).
[23]:
<matplotlib.image.AxesImage at 0x220963ac130>
Box Blur#
[24]:
box_blur_filter_mat = np.array([
    [1, 1, 1],
    [1, 1, 1],
    [1, 1, 1]
]) * 1/9
plt.imshow(apply_filter(a,box_blur_filter_mat))
[24]:
<matplotlib.image.AxesImage at 0x220962a8a30>

Gaussian Blur 3X3#
[25]:
gaus_blur_filter_mat = np.array([
    [1, 2, 1],
    [2, 4, 2],
    [1, 2, 1]
]) * 1/16
plt.imshow(apply_filter(a,gaus_blur_filter_mat))
[25]:
<matplotlib.image.AxesImage at 0x22096322ca0>

Gaussian Blue 5X5#
[26]:
gaus_blur_5x5_filter_mat = np.array([
    [1, 4, 6, 4, 1],
    [4, 16, 24, 16, 4],
    [6, 24, 36, 24, 6],
    [4, 16, 24, 16, 4],
    [1, 4, 6, 4, 1]
]) * 1/256
plt.imshow(apply_filter(a,gaus_blur_5x5_filter_mat))
[26]:
<matplotlib.image.AxesImage at 0x220965209d0>

Brighten#
[27]:
bright_filter_mat = np.array([
    [1, 0, 0],
    [1, 0, 0],
    [1, 0, 0]
])
plt.imshow(apply_filter(a,bright_filter_mat))
Clipping input data to the valid range for imshow with RGB data ([0..1] for floats or [0..255] for integers).
[27]:
<matplotlib.image.AxesImage at 0x220964258b0>
Custom Function#
[28]:
def custom_conv2D(matrix, kernel):

    k_r, k_c = kernel.shape
    f_r, f_c = matrix.shape

    max_rows = f_r - k_r + 1
    max_cols = f_c - k_c + 1

    new_frame = []

    for r in range(max_rows):
        new_row = []
        for c in range(max_cols):
            res = matrix[r : r+k_r, c : c+k_c ] * kernel
            new_row.append(res.sum())
        new_frame.append(new_row)
    new_mat = np.array(new_frame)

    return new_mat

def custom_image_conv(img, kernel):

    if len(img.shape) == 3:

        layers = img.shape[2]
        layer_mat = []

        for i in range(layers):
            mapped = custom_conv2D(matrix=img[:,:,i], kernel=kernel)
            layer_mat.append(mapped)

        new_mat = np.dstack(tuple(layer_mat))

    elif len(img.shape) == 2:
        new_mat = custom_conv2D(matrix=img, kernel=kernel)
    else:
        raise ValueError("shape is 1-D")

    return new_mat
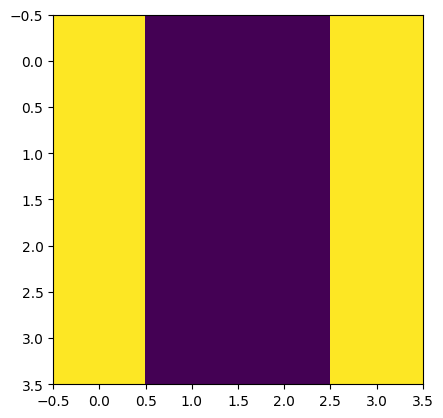
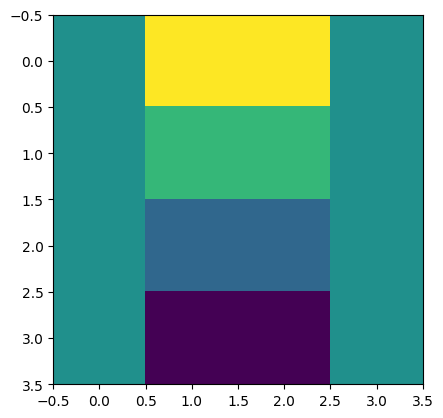
Vertical Edge#
[29]:
vertical_kernel = np.array([
    [1, 0, -1],
    [1, 0, -1],
    [1, 0, -1]
])
[30]:
feature_mat = np.array([
[10, 10, 10, 0, 0, 0],
[10, 10, 10, 0, 0, 0],
[10, 10, 10, 0, 0, 0],
[10, 10, 10, 0, 0, 0],
[10, 10, 10, 0, 0, 0],
[10, 10, 10, 0, 0, 0]
])
plt.imshow(feature_mat)
plt.show()
plt.imshow(vertical_kernel)
plt.show()
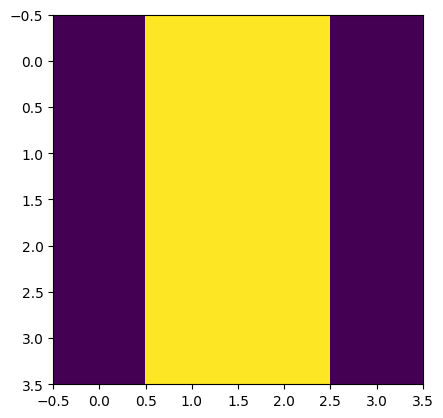
new_mat = custom_conv2D(matrix=feature_mat, kernel=vertical_kernel)
print(new_mat)
plt.imshow(new_mat)
plt.show()
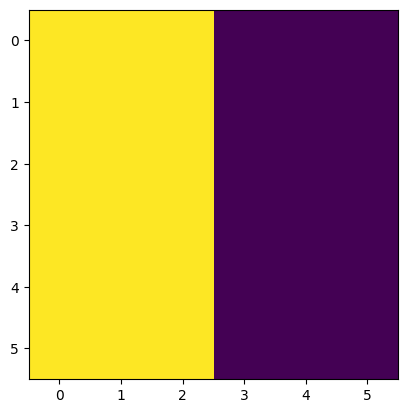
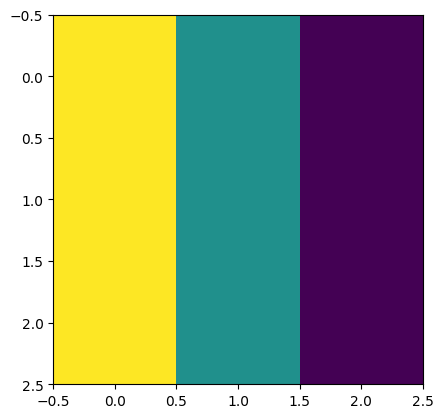
[[ 0 30 30  0]
 [ 0 30 30  0]
 [ 0 30 30  0]
 [ 0 30 30  0]]
[31]:
feature_mat = np.array([
    [0, 0, 0, 10, 10, 10],
    [0, 0, 0, 10, 10, 10],
    [0, 0, 0, 10, 10, 10],
    [0, 0, 0, 10, 10, 10],
    [0, 0, 0, 10, 10, 10],
    [0, 0, 0, 10, 10, 10]
])


plt.imshow(feature_mat)
plt.show()

plt.imshow(vertical_kernel)
plt.show()

new_mat = custom_conv2D(matrix=feature_mat, kernel=vertical_kernel)

print(new_mat)
plt.imshow(new_mat)
plt.show()
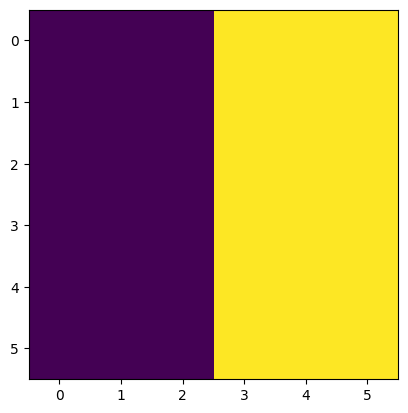

[[  0 -30 -30   0]
 [  0 -30 -30   0]
 [  0 -30 -30   0]
 [  0 -30 -30   0]]
[32]:
feature_mat = np.array([
    [10, 10, 10, 0, 0, 0],
    [10, 10, 10, 0, 0, 0],
    [10, 10, 10, 0, 0, 0],
    [0, 0, 0, 10, 10, 10],
    [0, 0, 0, 10, 10, 10],
    [0, 0, 0, 10, 10, 10]
])


plt.imshow(feature_mat)
plt.show()

plt.imshow(vertical_kernel)
plt.show()

new_mat = custom_conv2D(matrix=feature_mat, kernel=vertical_kernel)

print(new_mat)
plt.imshow(new_mat)
plt.show()
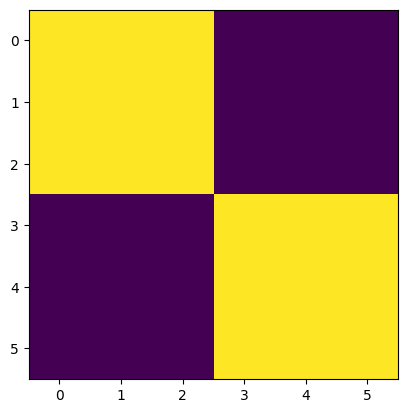

[[  0  30  30   0]
 [  0  10  10   0]
 [  0 -10 -10   0]
 [  0 -30 -30   0]]
[33]:
img = mpimg.imread("./images/rdj.jpg")

print(img.shape)
plt.imshow(img)
plt.show()

new_mat = custom_image_conv(img, vertical_kernel)
plt.imshow(new_mat)
plt.show()
(550, 550, 3)

Clipping input data to the valid range for imshow with RGB data ([0..1] for floats or [0..255] for integers).
[34]:
img = mpimg.imread("./images/rdj.jpg")

print(img.shape)
plt.imshow(img)
plt.show()

new_mat = np.sum(custom_image_conv(img, vertical_kernel),axis=2)
plt.imshow(new_mat,cmap='gray')
plt.show()
(550, 550, 3)

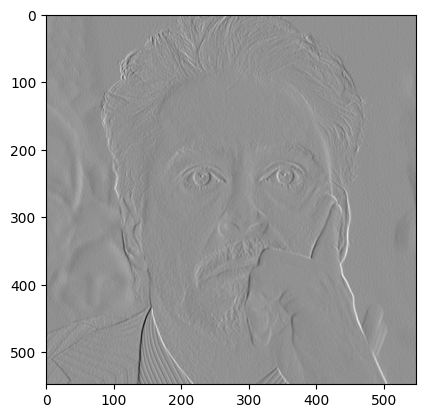
Horizontal Edge#
[35]:
horizontal_kernel = np.array([
    [1, 1, 1],
    [0, 0, 0],
    [-1, -1, -1]
])
[36]:
img = mpimg.imread("./images/rdj.jpg")

print(img.shape)

plt.imshow(img)
plt.show()

new_mat = custom_image_conv(img=img, kernel=horizontal_kernel)
plt.imshow(new_mat)
plt.show()
(550, 550, 3)

Clipping input data to the valid range for imshow with RGB data ([0..1] for floats or [0..255] for integers).
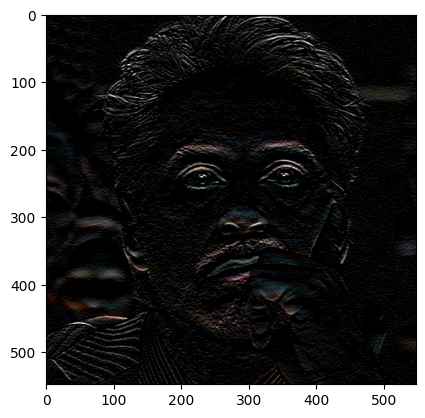
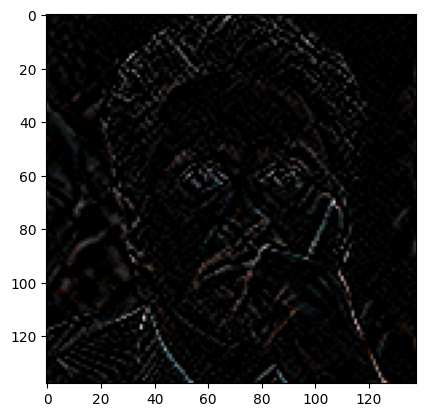
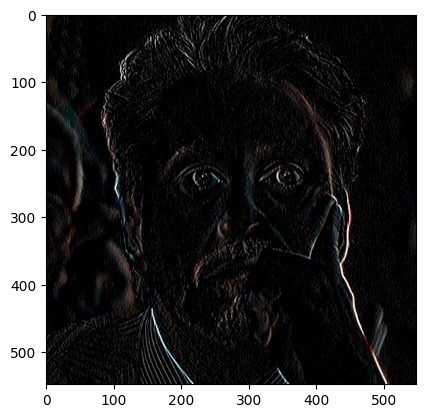
Sobel Operator#
[37]:
sobel_filter = np.array([
    [1, 0, -1],
    [2, 0, -2],
    [1, 0, -1]
])
[38]:
img = mpimg.imread("./images/rdj.jpg")

print(img.shape)

plt.imshow(img)
plt.show()

new_mat = custom_image_conv(img, sobel_filter)
plt.imshow(new_mat)
plt.show()
(550, 550, 3)

Clipping input data to the valid range for imshow with RGB data ([0..1] for floats or [0..255] for integers).

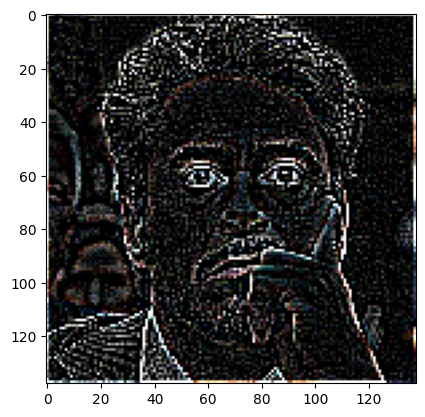
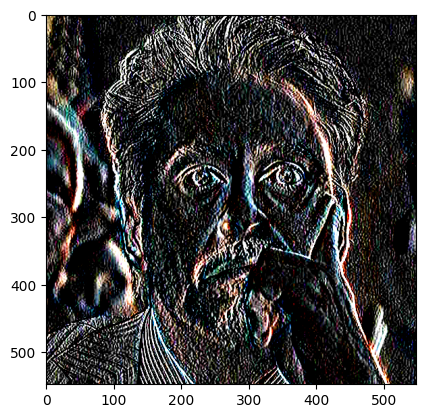
Scharr Operator#
[39]:
scharr_filter = np.array([
    [3, 0, -3],
    [10, 0, -10],
    [3, 0, -3]
])
[40]:
img = mpimg.imread("./images/rdj.jpg")

print(img.shape)


plt.imshow(img)
plt.show()

new_mat = custom_image_conv(img, scharr_filter)
plt.imshow(new_mat)
plt.show()
(550, 550, 3)

Clipping input data to the valid range for imshow with RGB data ([0..1] for floats or [0..255] for integers).
[ ]:
img = mpimg.imread("./images/rdj.jpg")

print(img.shape)

plt.imshow(img)
plt.show()

new_mat = custom_image_conv(img, scharr_filter.T)
plt.imshow(new_mat)
plt.show()
(550, 550, 3)

Clipping input data to the valid range for imshow with RGB data ([0..1] for floats or [0..255] for integers).